
DLS V8 Optimized: 远超预期的性能提升
几天前,我兴致勃勃得写了篇预告文章,因为那天有了重大发现。
在开始今天的解密之前,让我先回顾一下在此之前发生了什么。
Quick Glance Summary of performance
这是一份记录了各个迭代的性能变化的粗略数据:
| Version | Scale | Write Latency | Read Latency |
|---|---|---|---|
| V8 (Initial CBOR) | 100k | 460 µs | 4.5 µs |
| V7 (Compaction) | 100K | 266 µs | 12.2 µs |
| V6 (Zig 0.15.1) | 100k | 125 µs | 12.1 µs |
| V5 (Arena) | 100k | 122 µs | 29 µs |
| V4 (Flush) | 100k | 241 µs | 188 µs |
| V3 (1KB Msg) | 100k | 178 µs | 0.1 µs |
| V2 (WAL) | 10k | 115 µs | 0.11 µs |
| V1 (Memory) | 10k | 58 µs | 0.11 µs |
在上周,已经进行到了 DLS 项目的第 8 个迭代。是的,上面表格中的 V8。在这个迭代中,主要是对文件存储部分的协议做了切换,由原本的 JSON 文本协议换成了 CBOR 二进制协议。可以看到,从 V7 -> V8,读性能提升了 ~3x 倍,但写性能却下降了 73% 。对于这样的变化,委实是出乎我意料了,所以,原本的 V8 就成了 Initial CBOR 的版本,并计划在后续的一周至少让写性能恢复到 V7 的水平。
Wow! It's far beyond!
| Version | Scale | Write Latency | Read Latency |
|---|---|---|---|
| V8 (Optimized) | 100K | 74.76 µs | 3.35 µs |
| V8 (Initial CBOR) | 100k | 460 µs | 4.5 µs |
| ... | ... | ... | ... |
| V2 (WAL) | 10k | 115 µs | 0.11 µs |
经过几番努力,写延迟由 460µs 降低到了 74.76µs(此外,读延迟也降低了,但它不是主角了)。这甚至 超越了早期逻辑简单的基线版本 V2 的写性能。
这,是否勾起了你的兴趣?
V8 Initial CBOR 的问题到底在哪儿?
两眼一抹黑的情况下,先把所有的与写操作相关的函数调用的耗时记录下来。
往 LogEntry 加时间记录
pub fn encodeCbor(self: *const @This(), allocator: Allocator) ![]u8 {
    var b = try zbor.Builder.withType(allocator, .Map);

    const x = std.time.nanoTimestamp();

    try b.pushTextString("timestamp");
    try b.pushInt(@intCast(self.timestamp));

    // push other fields

    tu_push += std.time.nanoTimestamp() - x;
    cnt_push += 1;

    const y = std.time.nanoTimestamp();
    const result = try b.finish();
    tu_finish += std.time.nanoTimestamp() - y;
    cnt_finish += 1;

    return result;
}
往 model.zig 模块中增加了两组全局变量:
tu_push和cnt_push: 分别记录 zbor builder 的pushXxx的总用时, 以及总次数tu_finish和cnt_finish: 分别记录 zbor builder 的finish的总用时, 以及总次数
往 Wal 中增加时间记录
pub fn append(self: *Wal, allocator: Allocator, entry: *const LogEntry) !void {
    const x = std.time.nanoTimestamp();
    const encoded = try entry.encodeCbor(allocator);
    defer allocator.free(encoded);
    self.tu_encodeCbor += std.time.nanoTimestamp() - x;

    const y = std.time.nanoTimestamp();
    const crc = std.hash.Crc32.hash(encoded);
    try self.f.writeAll(&std.mem.toBytes(crc));

    try self.f.writeAll(&std.mem.toBytes(@as(u32, @intCast(encoded.len))));

    try self.f.writeAll(encoded);
    self.tu_writeAll += std.time.nanoTimestamp() - y;

    try self.f.sync();
}
往 wal.zig 模块中增加:
tu_encodeCbor: 记录所有append调用的总用时tu_writeAll: 记录所有writeAll调用的总用时
往 MemTable.writeLog 中增加 flush 的时间记录
pub fn writeLog(self: *MemTable, entry: LogEntry) !void {
    // code snippets that write the `entry` to wal file

    // Check if flush is needed
    if (self.entries.items.len >= self.config.flush_threshold) {
        const x = std.time.nanoTimestamp();
        try self.flush();
        self.tu_flush += std.time.nanoTimestamp() - x;
        self.cnt_flush += 1;
    }
}
往 memtable.zig 模块中增加了一组全局变量:
tu_flush和cnt_flush: 分别记录flush的总用时,以及总次数
往 writeManyLogs 中增加时间记录
test "writeManyLogs" {
    // setup code now shown here

    const entry_count = 100_000;

    var timer = try std.time.Timer.start();

    var msg_1k: [1024]u8 = undefined;
    @memset(&msg_1k, 'x');

    var arena_write = ArenaAllocator.init(testing.allocator);
    defer arena_write.deinit();

    const allocator = arena_write.allocator();

    // Measure write time
    const write_start_ns = timer.read();
    var tu_write_log: i128 = 0;
    for (0..entry_count) |i| {
        const message = try std.fmt.allocPrint(allocator, "INFO | test log {d} {s}", .{ i, msg_1k });

        const x = std.time.nanoTimestamp();
        try mt.writeLog(try createTestLogEntryWithMetadata(allocator, message, "{\"level\":\"INFO\"}"));
        tu_write_log += std.time.nanoTimestamp() - x;
    }
    const write_time_ns = timer.read() - write_start_ns;

    std.debug.print(
        \\writeManyLogs (threshold={d}):
        \\  tu_writeLog     {d} ns
        \\  MemTable:
        \\    cnt_flush     {d}
        \\    tu_flush      {d}us per round
        \\  Wal:
        \\    tu_encodeCbor {d}us per entry
        \\    tu_writeAll   {d}us per entry
        \\  LogEntry:
        \\    tu_push       {d}us per entry
        \\    tu_finish     {d}us per entry
        \\
    , .{
        mt.config.flush_threshold,
        tu_write_log,
        mt.cnt_flush,
        @divFloor(mt.tu_flush, mt.cnt_flush * std.time.ns_per_us),
        @divFloor(mt.wal.tu_encodeCbor, entry_count * std.time.ns_per_us),
        @divFloor(mt.wal.tu_writeAll, entry_count * std.time.ns_per_us),
        @divFloor(model.tu_push, model.cnt_push * std.time.ns_per_us),
        @divFloor(model.tu_finish, model.cnt_finish * std.time.ns_per_us),
    });
}
执行性能测试用例 writeManyLogs
writeManyLogs (threshold=1000):
  tu_writeLog 50551941000 ns
  MemTable:
    cnt_flush 100
    tu_flush 309560us per round
  Wal:
    tu_encodeCbor 137us per entry
    tu_writeAll 19us per entry
  LogEntry:
    tu_push 64us per entry
    tu_finish 60us per entry
V8 Initial 的性能解读:
- 该用例写入 100K entry, 刷盘到 sstable 文件的阈值设的是 1000, 因此会有 100 次刷 sstable
- 比对
tu_writeLog和 MemTable 时间:总用时为 50.6s,其中MemTable.flush被调用了 100 次共用时 31s, 这部分数据仅用于了解整体时间占比 - 结合 Wal 和 LogEntry 这两组时间:
tu_writeAll是将数据同步到磁盘的用时,占比很小Wal.tu_encodeCbor=LogEntry.tu_push+LogEntry.finish+ other,即 137 = 64 + 60 + 13(other),encodeCbor 的大部分时间确实是被 zbor 库占用了
在 V7 上执行性能测试用例 writeManyLogs
上面所列的时间记录的代码只是临时在 V8 上增加的,原本 V7 的代码并没有时间记录。为了弄清楚到底 V7 vs. V8 Initial 有多大的区别,我又往 V7 版本的代码上增加了类似的记录时间的代码,并执行了相同的测试用例。得到的性能测试结果如下:
writeManyLogs (threshold=1000):
  tu_writeLog 26773171000 ns
  MemTable:
    cnt_flush 100
    tu_flush 155488us per round
  Wal:
    tu_ser 55us per entry
    tu_writeAll 18us per entry
  LogEntry:
    tu_ser 55us per entry
V7 的性能解读:
MemTable.flush每次只用了 155ms- JSON 版的
Wal.append调用,每次用时 55us
V8 Initial 和 V7 的性能对比分析
说实话,当时是真的不理解为什么会慢这么多……
于是乎,请教了 Claude,它说这个 Zbor 库可能在这个场景下的性能就是不太好,建议我:
- 要么换一个 zig 的 cbor 实现
- 要么改用 cbor 的 c 语言实现
- 要么给 Wal.append 增加批量写入
…… 以让写性能重新回到至少 V7 的水准。然后我确实也……
- 去调研了zig的其他cbor实现:发现那个自从在某个论坛自我推广了一番之后,就再没有过更新,且它当时也仅仅以满足符合协议为基本要求,并没有考虑到性能
- 去调研了cbor的c实现:发现也不太易用,至少并没有一个广泛的共识说推荐使用哪一个,这说明少用人走这条路
- Wal.append 批量写入:这个思路就不太对,这属于曲线救国,没有解决本身的问题
思来想去,要不把 zbor 的代码拉下来,写个最小版本的 JSON vs. zbor 的性能测试用例对比吧
第二次尝试:在 zbor 上写性能测试
该不会 github 的 zbor 库真的有性能问题吧?我要不给它写个性能测试用例?如果真有问题,大不了提个 PR 好了……
zbor 基本性能测试
把 zbor 从 github clone 下来后,直接往 builder.zig 中增加了两个非常简单的用例:
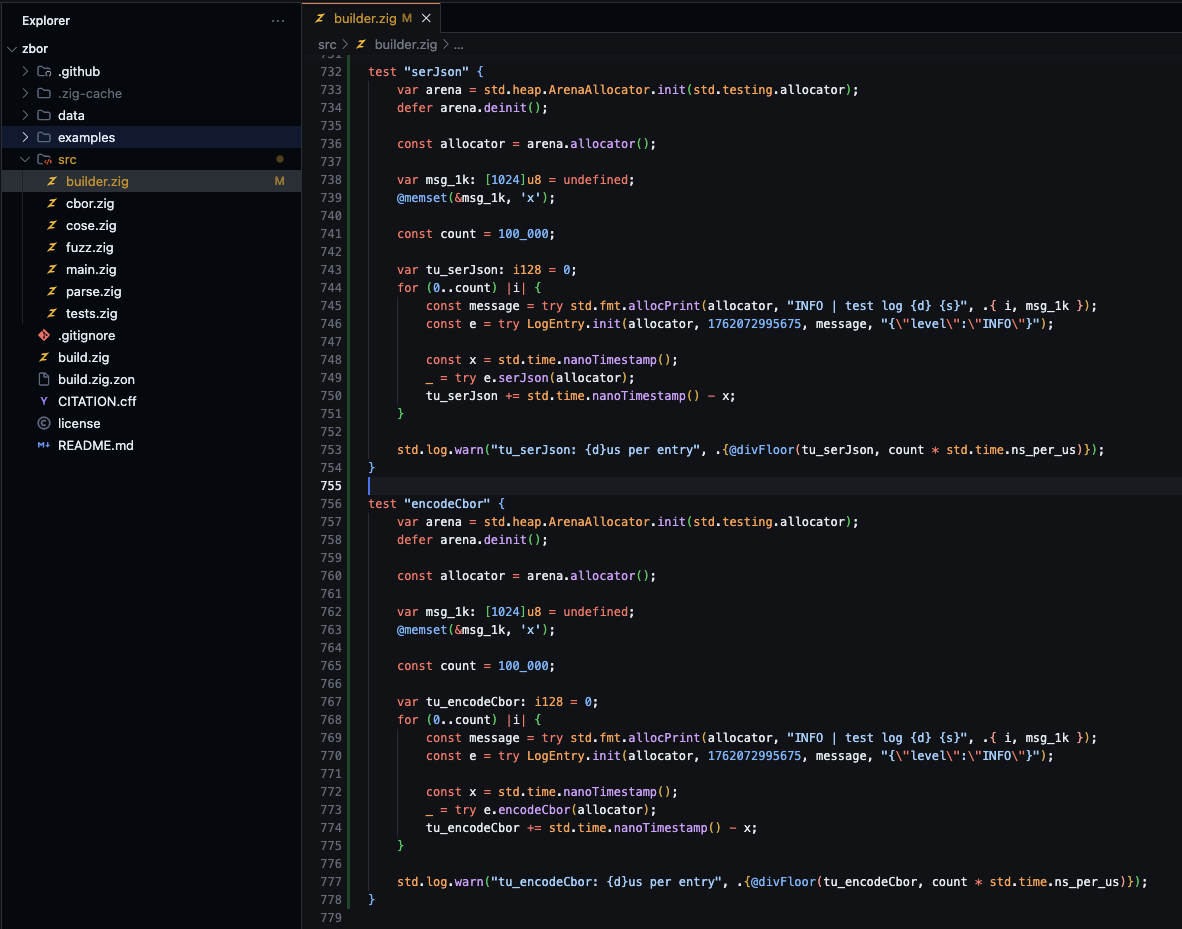
测试结果:
[default] (warn): tu_serJson: 6us per entry
[default] (warn): tu_encodeCbor: 2us per entry
啊?这里的 zbor 是比 json 快的啊!完了,有点邪门……
于是乎,我又把上面两个测试用例搬到了 DLS 项目中来执行,它确实还是 zbor 比 json 快!
为什么……这跟我代码里的性能测试结果是相反的啊!
我很蒙圈,然后往 DLS 项目里同时增加了 json 协议 和 cbor 协议 的改造,同时执行两组性能测试用例,结果还是一样:
- test group a: MemTable 的性能测试中,cbor 比 json 慢得多
- test group b: zbor 的基本性能测试
test serJson()和test encodeCbor()中,cbor 比 json 快得多
走投无路了,问了 Grok,它说它可以确定是 allocator 的差异,因为 test group b 中用的是 ArenaAllocator 而 test group a 中用的是 GeneralPurposeAllocator。大致意思说,GPA 有额外的锁检测、安全检测等,在使用 zbor 库时有大量的 pushXxx 调用,这会频繁向 OS 发起内存调用,而 Arena 更适合这种场景。如果使用 Arena,我就会得到比现在大概快 3~5 倍的性能。
我管它三七二十一,先验证下改成 Arena 后,Wal.append 的性能会不会有变化。
(PS:其实,在得到 allocator 差异这个最终答案的过程之中,是挺手足无措的。并不像上面写的这么简单,轻易的就从 Grok 那里获得了答案。现在我已经记不清当时经过了多少轮的对话,反反复复的尝试。只记得了这个最后让我激动无比的答案。)
实践出真知,还得是 Arena
各位不用多想了,确实是 Allocator 的使用的问题。将先前用 GPA 的地方,全部切换为了 Arena 之后,性能测试结果来到了:
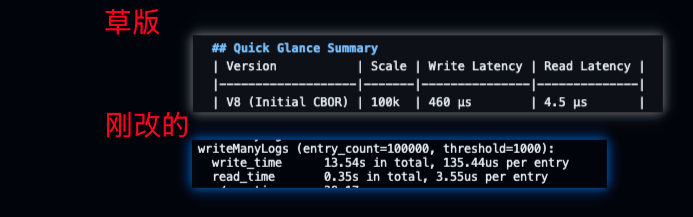
这个优化的结果,已经达到了我最早设定的目标:至少达到 V7 的水准。
(现在已经没有详细的这一版的测试结果了,因为,两天之后,又有了新的突破,而这个第一版优化的代码当然就不复存在了)
第三轮:只是试探性的,继续往前走着
上面说,是 Allocator 的问题,所以我又回头……
- 问了 Grok 各种 Allocator 的使用场景:嗯,很详细
- 翻了官方文档对于各种 Allocator 的使用场景的说明:有一点用,但没那么大,官方文档的深度和覆盖面都比较欠缺
- 翻了之前看过的另一篇关于 Allocator 的在线电子书
重点来了,为了从设计层面保证 Allocator 的使用正确性,我又抽空整理了一份 DLS 关于文件持久化使用到的 Allocator,形成了一份详细的时序图:
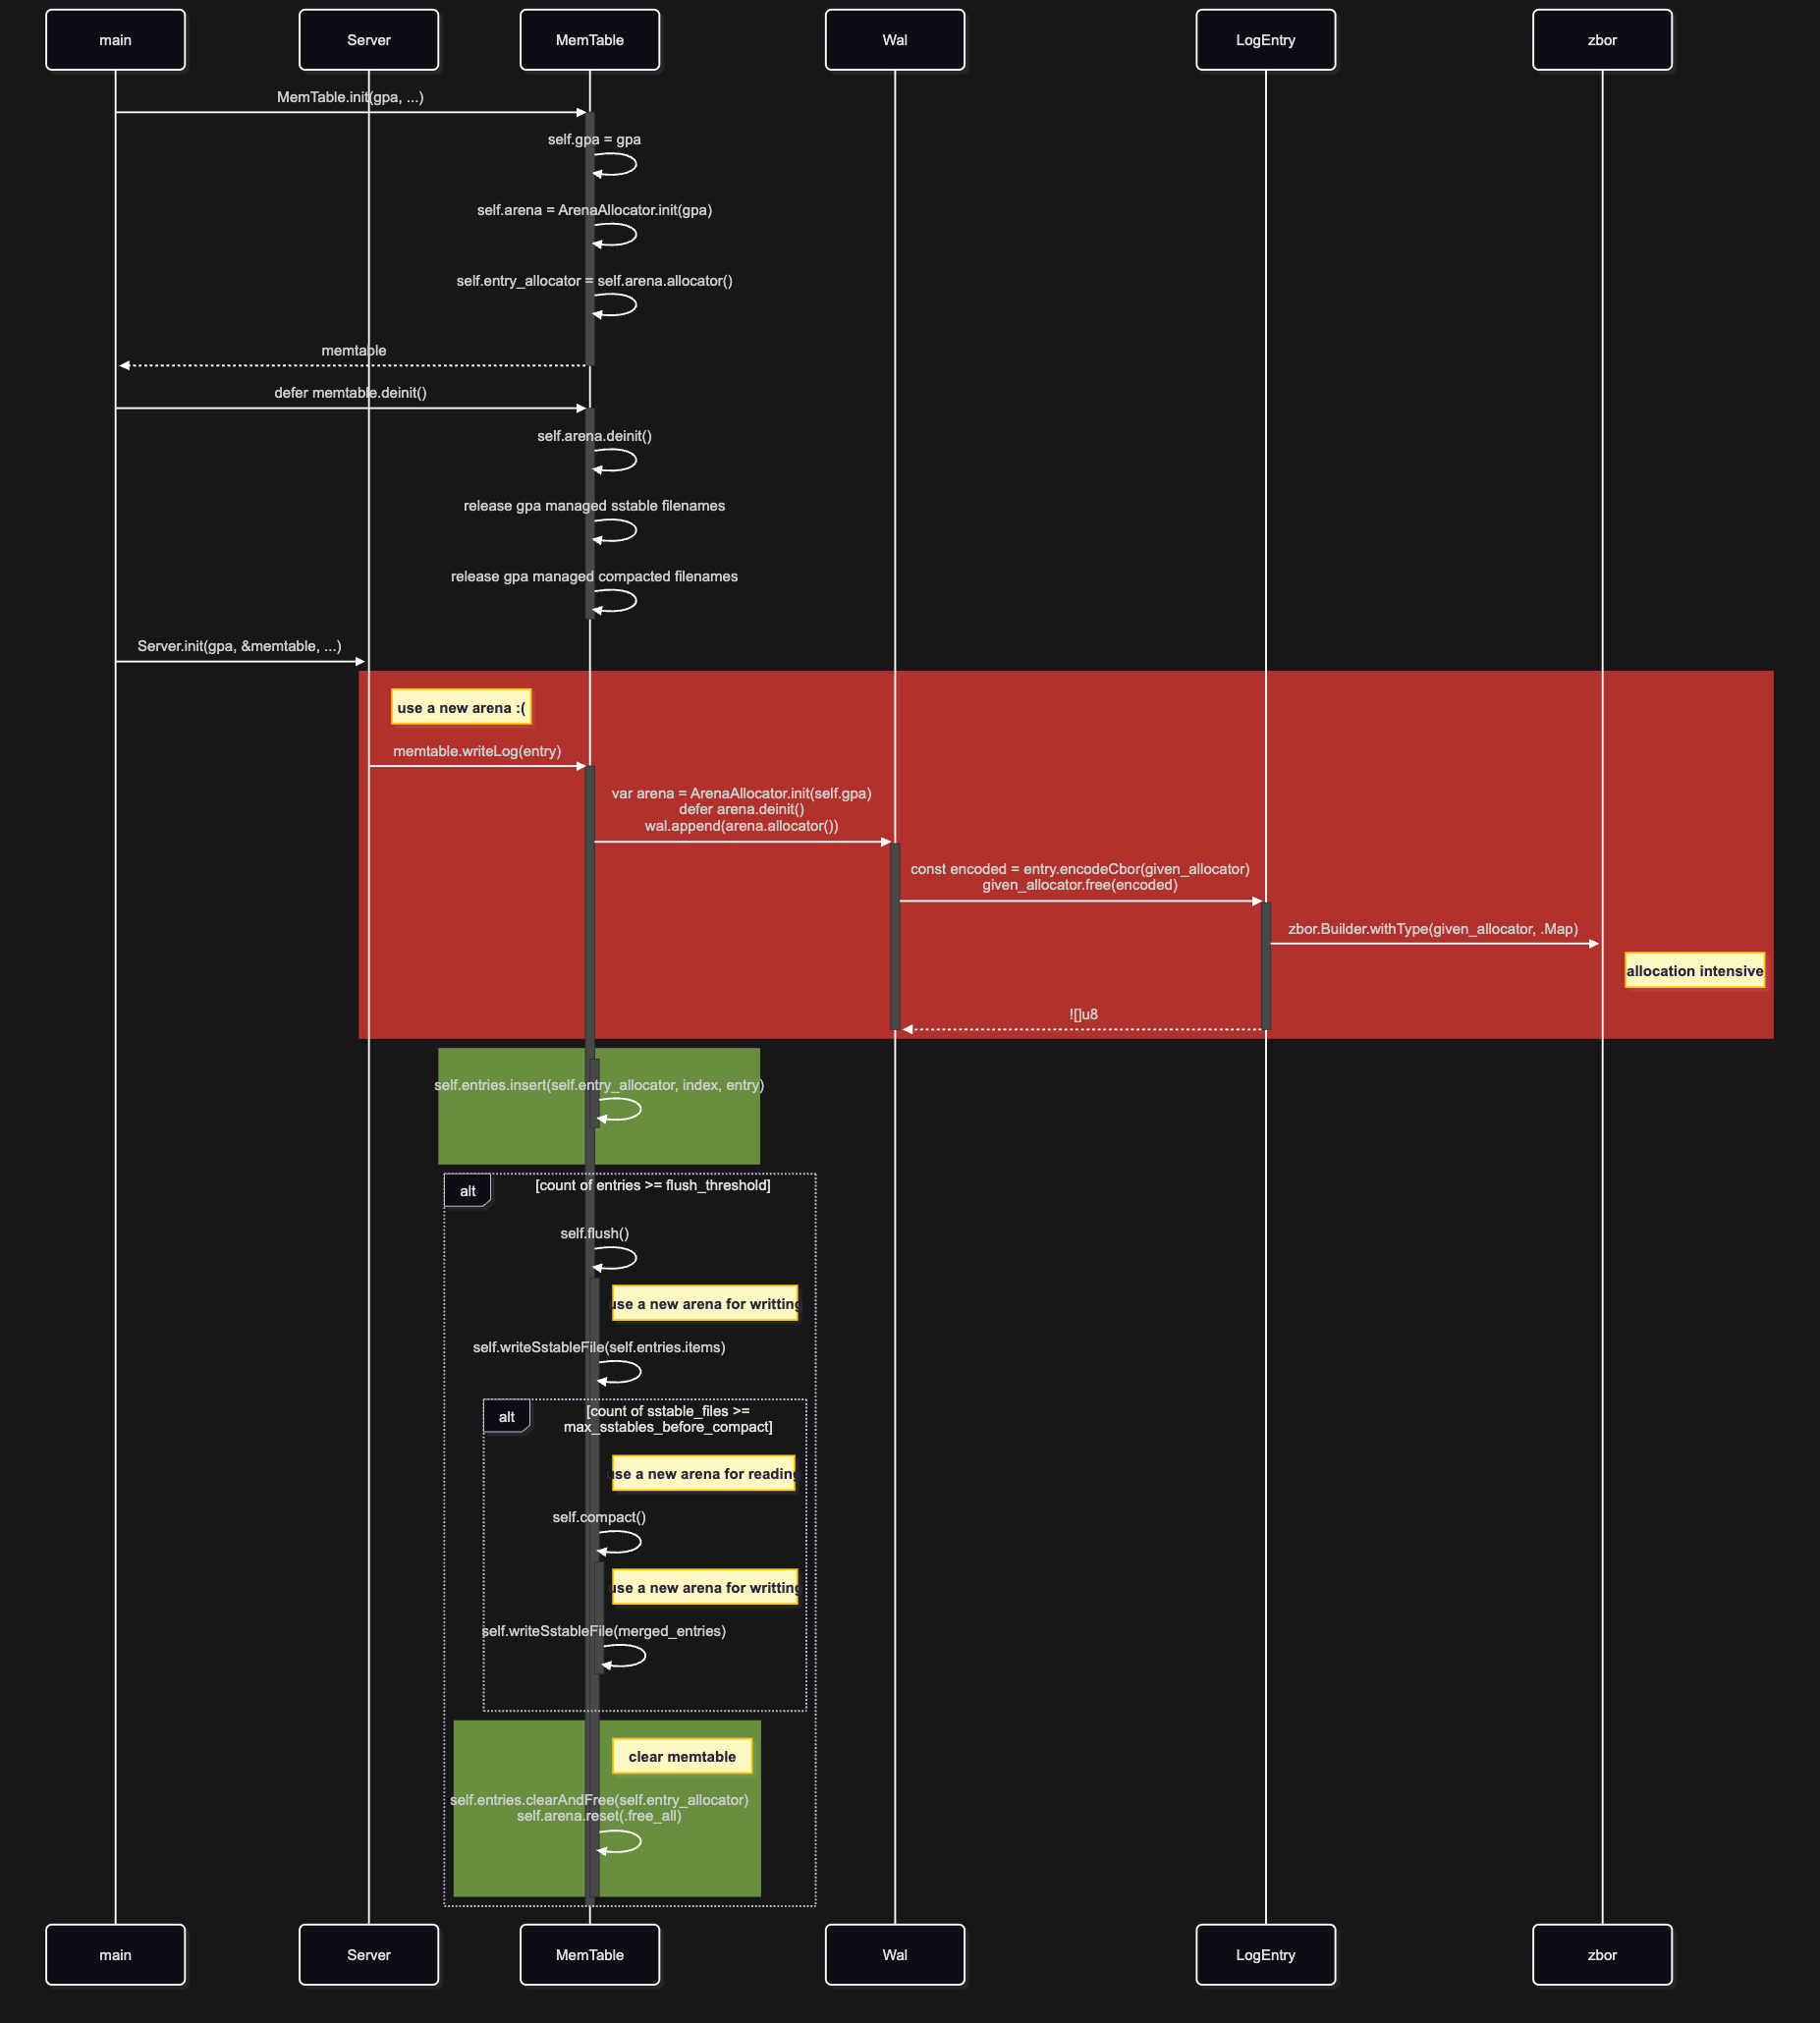
上图中标红色的是新发现的一个优化点,虽然这里用的是 Arena,但每次写日志到 wal 文件的时候,都新建了一个 Arena,而这个错误与我先前 V5 设计的 flush scope 内通过同一个 Arena 来进行内存管理有出入。所以,我又一次将这里的 Arena 改为了复用 MemTable.entry_allocator 这个专门用于 flush scope 内的 arena。
这样,就来到了最后的版本,测试结果如下:
writeManyLogs (entry_count=100000, threshold=1000):
  write_time      7.48s in total, 74.76us per entry
  read_time       0.34s in total, 3.35us per entry
  w/r ratio       22.30

  MemTable:
    tu_flush      23068us per flush
    cnt_flush     100

  Wal:
    tu_encodeCbor 3us per entry
    tu_writeAll   20us per entry

  LogEntry:
    tu_push       2us per entry
    cnt_push      300100
    tu_finish     0us per entry
    cnt_finish    300100
在这一版,我对输出格式做了优化,阅读起来更容易,毕竟以后少不了对它做优化。
结语
有如今的结果,我认为,一半成于死磕,一半成于专业。我一向认为设计是最重要的,所以才一定要画了这个时序图,没了纲领,只着眼于细节,最终只会迷失。其中依然还有空间可图,但适可而止就好,毕竟优化是没有尽头的。
接下来,我将继续完成最核心的任务,走向分布式。
不过,现在的性能数据到底意味着什么?
writeManyLogs (entry_count=100000, threshold=1000):
  write_time      7.48s in total, 74.76us per entry
  read_time       0.34s in total, 3.35us per entry
翻译一下,就是:
- 每秒可写入 1.3w+ 1KB 大小的日志
- 每秒可扫描 29.8w 条 1KB 日志
- 对了,以上都仅仅是运行在单线程下